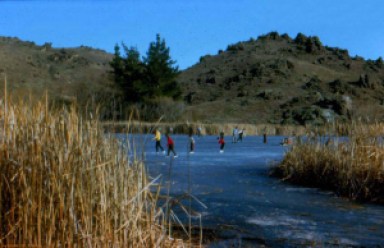
Growing up in Alexandra (Central Otago, New Zealand) in the early 1970s it was the family thing to go ice skating on the Manorburn Dam, a short drive from town. It was a very social occasion, with heaps of the rest of Alexandra there too, daytime and after dark too. You could either go on the natural ice of the dam itself, or restrict yourself to the artificial rink. Even in those days was I impressed with the nonchalance that a Massey-Ferguson tractor was driven over the ice. I have a distinct memory of trying to waltz around the artificial rink to the sound of the Al Martino’s “Walking in the Sand” on hired skates that probably hadn’t been sharpened since 1950. And then it all stopped. Life went on and somehow skating wasn’t part of it.
Maybe twenty years later, out of curiosity, I drove back up to the dam – to find the old rink derelict. I should have been expecting it, but it was a kind of depressing shock all the same. What had happened? My gut feeling was that things had warmed (“You young whipper-snappers, when I was a kid the winters were really cold!”). But perhaps that wasn’t the story at all, or maybe only part of it. A bit of Googling and I came across Ryan Hellyer’s blog, who points out that “Since 1992 the number of skaters making use of the dam has plummeted due to the local ice sports organisation no longer officially opening the dam for skating”. There is now an artificial rink in Alexandra. Both of these factors would have killed the activity at Manorburn. But were the concerns driven less-predictable natural ice? That I don’t know, though Helleyer does note that the dam does freeze “most years”.
My curiosity well and truly piqued, I thought it was time to try and chase up some hard data. Most folks probably think the climate is a bit different from when they were kids – but have there been any real trends? It turns out you can register with NIWA (thanks Garth) and access all the old climate records. There are some records for the Manorburn itself, but by far the longest stretch of data is from Alexandra. Unfortunately these are in three sets, from three slightly different locations. Probably of no concern, but worth keeping in mind.
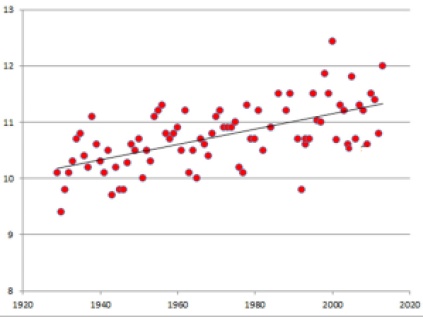
The most basic metric is the run of annual means of temperature (MAT). What immediately stood out was that last year had the highest MAT (12C) since records began in 1929. However, things weren’t quite so straightforward – as the annual dataset misses out a few years. I figured they may be in the monthly record datasets, and sure enough, they were – but many years only include data for 11 months. For example, the year 2000 was missing from the annual averages, but there are only data for nine months in the monthly records. Taken at face value, that year, 2000, has the record at 12.4C. I haven’t the faintest idea what is going on with the missing values, but I doubt they impact on the overall averages. From the data available the first twenty years of records, from 1929 to 1948 had an average MAT of 10.2C. The average MAT for the last twenty years had been 11.3C. Apparently a 1C rise in MAT.

Graph of annual means of temperature (C) for Alexandra. Data from The National Climate Database, NIWA.
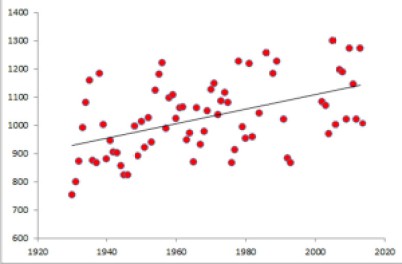
Another metric is the ‘Growing Degree Days’. This is the number of days above a certain temperature, below which little or no plant/animal growth may occur, multiplied by the average temperature. Basically it gives an idea of cumulative warmth. For Alexandra, the Growing Degree Days above 10C have risen from an average of 930 for the first twenty years of records, to 1099 in the last twenty years. The increase of 170 would be equivalent to something like an extra 15 days now that have an average temperature above 10C than there were around 1940.
The data indicate that Alexandra has experienced a modest increase in temperature over the past few decades. This may not be what killed our outdoor skating, but it’s definitely food for thought and there are various other climate metrics that would be worth having a look at.


2 comments
I don’t think this is too surprising. Whenever you build a township, temperatures typically increase. Then throw in the construction of multiple irrigation dams which provide a huge heat sink and alter wind conditions, followed by two giant hydroelectric dams, including one extremely nearby, and I’d expect the climate to be impacted in a measurable way.
I hadn’t seen this until now. Thanks for mentioning my site. I’ve heard many people commenting on the ice conditions around Alexandra. I think it’s hard to tell if there’s more or less ice than there was in the past, but if there is less ice now then I think that is easily attributable to the construction of first the Roxburgh dam and then the Clyde Dam, both of which will have had an impact on the local climate after their construction. It the effects of those two dams will have far more impact on local ice conditions than any global climate changes would.