
What happens when a seal swallows a lump of limestone?
***
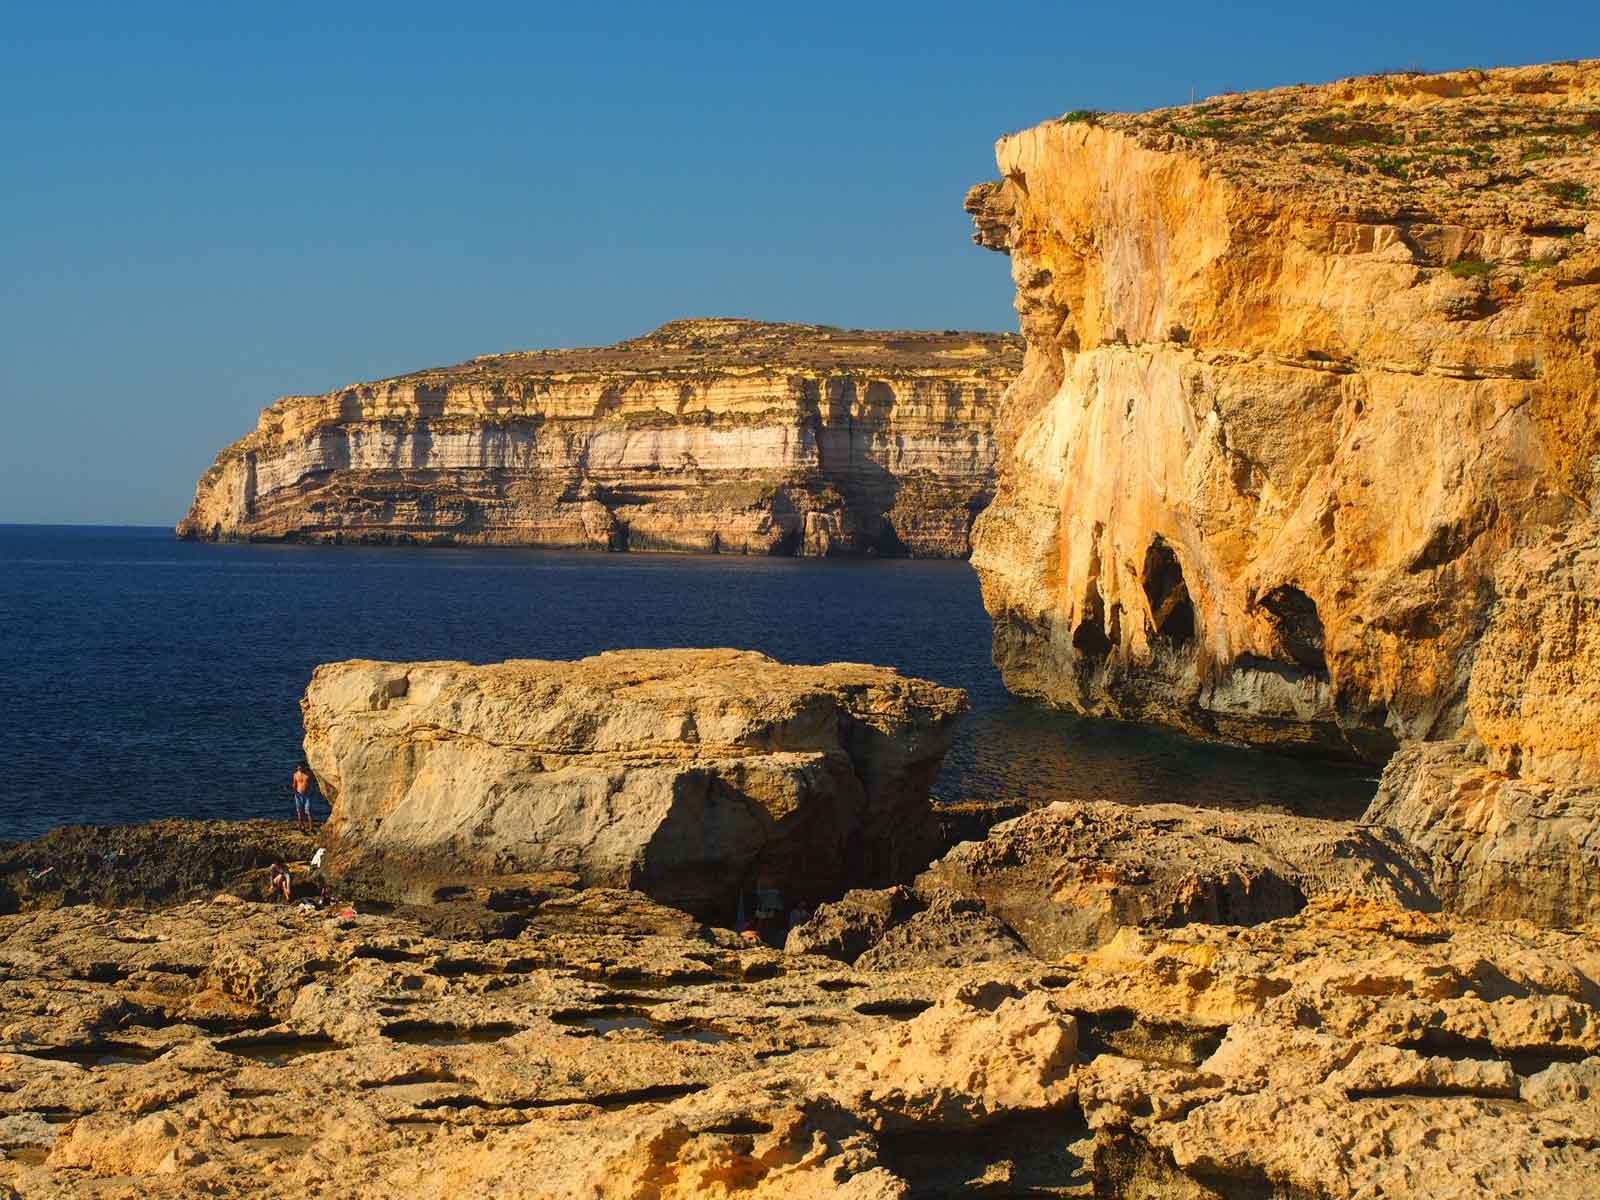
The broad theme of my back-packing trip last year was to move around the northern rim of the Mediterranean (and visit a few of its islands along the way). During much of that trip, limestone was in my face. I trekked over it in the Albanian Alps, trained through it in the Austrian Alps, climbed it at Žabljak in Montenegro, and wandered over forest-covered limestone in the Balkans National Park and visited archaeological sites built of it in Greece, Sardinia and Malta (the featured image is Dwejra Point on Malta). On other trips I’ve swum over limestone on the Croatian coast, wandered over it in the United Arab Emirates and Iran, and I’ve worked on it in central Turkey. Limestone gives so much character to that huge region, it could be named after it – ‘Limestonia’ or something. By and large, this huge extent of limestone was formed in the shallow seas of an ocean that once extended from the Mediterranean through to the Middle East. It has been called the Tethys, and the modern Mediterranean is essentially its much smaller progeny.

Limestone is the most visible part of the ‘long-term carbon cycle’. It’s the millions of years long process by which carbon flows through the Earth’s atmosphere (mainly as Carbon Dioxide) and surface (as solids, such as limestone, and in dissolved forms). I thought of this after coming across one of Tony Heller’s YouTube videos a few weeks ago. Heller has a thing about climate, and his blog by-line is “setting the record straight about climate change”, and his video was called ‘Basic Science For Climate Scientists’. I’m a complete sceptic and always keen to know that I’ve got ‘basic science’ right, – so, I thought I would check this video out.
As Heller tells his audience that “Climate modellers add nothing meaningful to science”, he shows two superimposed graphs, one of global temperature going back 600 million years, and the other of carbon dioxide. His point is to show that there is no correlation between the two. You can immediately ignore this argument, because there would only be a direct link between carbon dioxide levels and global temperature if all else were equal. And over 600 million years, they weren’t.
It was the graphs themselves that caught my eye. The one purporting to show 600 million years of global temperature was only referenced by a name (C.R. Scotese) but with no date. Long story short, the graph is an early attempt by Chris Scotese to estimate global temperature. You can see his most up to date work here. Scotese will be perfectly aware that his global temperature estimates are just that – and not (yet) appropriate for a comparison with CO2 levels.
But it was the second graph that was of more interest. It was credited to ‘R.A. Berner 2001’, but will actually be Berner and Kothavala (2001). Let’s go back, not the 18 years to when that paper was produced (apparently the most recent paper someone “setting the record straight” could find on the history of CO2 levels), but to 1983 when Berner and two colleagues produced a landmark scientific work. It was the first attempt to figure out what past atmospheric carbon dioxide levels were – basically from first principles. I remember coming across the paper shortly later – and scoffing at it. I was incredulous about how the carbon dioxide levels of millions of years ago could be worked out. Frankly, it went right over my head (in other words, I was too clueless to understand its significance). It took years before I had the sense to read through it carefully (and work through what it was saying with an Excel spread-sheet).

Berner and his colleagues understood the ‘long-term carbon cycle’. At the core of this process, volcanoes expel carbon dioxide into the atmosphere, rock weathering helps get this out of the atmosphere and transport it (in a soluble form) to the sea, where creatures such as shell fish and corals turn it into limestone. Over long periods, geological processes can then either shove the limestone onto land, or send it down a deep trench where it gets cooked, and then come back up as CO2 gas via volcanoes to compete the cycle. Berner and co had the audacity to want to quantify all this.
They needed to get the numbers for each of the critical steps of this cycle, and they needed the amounts going in and out at each step, to balance – for the present day Earth. They had to research things as esoteric as the average composition of the worlds river water and how much water rivers actually discharge to the sea. If their numbers were badly out, the cycle would go out of kilter, with CO2 either running out, or becoming outrageously high. But once they were satisfied they had the numbers balancing for the present – they could then start exploring the past.

The key piece of evidence they could use to see how the system responded back millions of years, was the rate of ocean floor spreading. From the spacing of magnetic stripes on the sea floor, they knew this was higher in the Cretaceous. That implies that there was also more volcanicity, and therefore more CO2 being erupted into the atmosphere. On top of that, because new sea floor is hot, it takes up more volume – and because there was more new sea floor in the Cretaceous, sea levels had to be higher, and consequently, global land area was smaller. There was therefore less rock exposed to be weathered and to remove CO2 out of the atmosphere. Both of these processes acted to increase levels of atmospheric CO2. However, they knew that “increased CO2 causes increased temperatures” (because of the Greenhouse Effect) “which in turn cause increased weathering”. Based on chemistry, they could estimate how much faster rock weathered in the warmer climates when there was more CO2.
In the end, Berner and colleagues calculated carbon dioxide levels going back 100 million years. A major conclusion was that carbon dioxide levels in the Cretaceous atmosphere were “distinctly higher than exists today” (or rather, that of when the paper was written). The increased greenhouse effect was a good explanation as to why fossils were indicating that the Cretaceous was a warmer time.

Berner then followed the success of that first model with a series of much more detailed improvements. The 2001 version that Heller cites in his video extends back 600 million years, includes, for example, not only the amount of land-surface weathering at different times, but the relative amounts of rock types (it makes a difference, whether say, volcanic basalt is weathering, or granite). The publications put out by Berner and colleagues are a variety of model to understand how the Earth works as a system. Yes, they are models. In fact, the first three words of the abstract of that 1983 paper are “A computer model”.
But, hang-on? So Tony Heller’s video is using the results of a model (he calls it “the actual science”) to point out how useless models are?
Yep.
And not only that, Heller is using a model, which explicitly factors in greenhouse science, where higher levels of carbon dioxide is the key driver behind higher atmospheric temperatures – to argue that … carbon dioxide is basically irrelevant.
To date Heller’s video has received over 2,000 likes, with 1,677 people leaving comments, exclusively as far as I can tell, saying what an amazing video it was. That sounds impressive. But not one of those hundreds of viewers has hauled Heller up over the very basic points of why it’s OK to accept the results of a model to argue models are useless, or to use a model which incorporates basic greenhouse theory, into an argument that the basic greenhouse theory is wrong.
That’s a lot of people who haven’t made the first step towards being sceptical – a basic background check on what’s being presented to them. They should. But don’t haul me about it – haul up Heller.

***
So where was I going with that seal thing? Some time back in the 1980s, I was sitting in the tea room of the Geology Department, Otago University, in the company of Rob Bearlin (who was doing his PhD on fossil whales). Someone brought up the news that seals sometimes swallowed rocks on the sea floor, to help with their buoyancy. This triggered the daft comment about what would happen if one of those rocks was limestone. Well, for the past thirty years I’ve carried this image of a rather startled seal surfacing on the ocean, wide-eyed as it lets out an enormous belch, after mistakenly swallowing a lump of limestone. The resulting eruption of carbon dioxide as the rock hit the seals digestive juices would have been dramatic.
Turns out, there is a geological analogy to that seal. In the geological world, most of the sea floor that gets transported down a deep ocean trench, and much later (partly) comes back up through volcanoes, is sand and mud, and not too much limestone. However, consider what happens when an entire coral reef, or similar sized chunk of limestone, gets swallowed? After it gets cooked deep below the surface, the eventual volcanic belch of carbon dioxide would be phenomenal, and geologically rather rapid – and ought to be enough to markedly warm the Earth. So has this ever happened? That question has been a magnet to those who are curious about the Earth system.
The nemeses of the ancient Tethys Ocean was mainly Africa (it also involves India). Over millions of years Africa rafted north, and finally collided with Europe, sandwiching the Tethys in-between. In this collision, some of the limestone which had formed on the Tethys sea floor was thrust up, where I could later see it. But other limestone would have been forced downward, cooked, and then come up volcanoes as carbon dioxide. This topic is an active field of research right now (e.g. Hoareau et al, 2015) – but the flip-side of all that limestone that I’ve seen, in a sense – the limestone that I didn’t see, is probably one reason why the climate of about 50 million years ago was much warmer than today.
References
Berner, R.A., and Kothavalam, Z. 2001. GEOCARB III: A revised model of atmospheric CO2 over Phanerozoic time,. American Journal of Science, 301:182–204.
Berner, R.A., Lasaga, A.C., and Garrels, R.M. 1983. The Carbonate-Silicate geochemical cycle and its effect on atmospheric carbon-dioxide over the past 100 million years. American Journal of Science, 283:641-683.
Hoareau, G., Bomou, B., van Hinsbergen, D.J.J., Carry, N., Marquer, D., Donnadieu, Y., Le Hir, G., Vrielynck, B., and Walter-Simonnet, A.-V. 2015. Did high Neo-Tethys subduction rates contribute to early Cenozoic warming? Climate of the Past, 11:1751-1767. <10.5194/cp-11-1751-2015.